Sleep Efficiency Calculator
Sleep efficiency measures how much of your time in bed you actually spend asleep. It is calculated by dividing total sleep time by total time in bed and multiplying by 100. A healthy score falls between 85–94%. Scores above 95% may indicate sleep deprivation; scores below 85% suggest insomnia patterns that respond well to CBT-I therapy. Enter your data below for your exact score, clinical interpretation, and evidence-backed steps to improve it tonight.

A healthy sleep efficiency score is 85–94%. This means you are spending at least 85% of your time in bed actually asleep. CBT-I therapists use 85% as the clinical cut-off between healthy sleep and insomnia. A score above 95% may paradoxically signal sleep deprivation rather than excellent sleep. Below 85% indicates excess time awake in bed — the core driver of conditioned arousal and chronic insomnia. The American College of Physicians endorses CBT-I, guided by SE scores, as the first-line treatment for chronic insomnia — above sleeping medication.
Calculate Your Sleep Efficiency Score
Enter your average sleep data from the past 7 nights for the most accurate result. All calculations happen instantly in your browser — nothing is stored.
–
–
–
–What Sleep Efficiency Actually Measures
Sleep efficiency is the primary clinical metric used in polysomnography (sleep lab studies) and CBT-I therapy. Unlike total sleep duration, SE specifically measures sleep quality — the ratio of time you are actually unconscious to time you spend in bed. It is the most sensitive early clinical indicator of insomnia disorder and the steering mechanism for the world’s most effective insomnia treatment.

Total Sleep Time = Time in Bed − Sleep Onset Latency (SOL) − Wake After Sleep Onset (WASO) − Early Morning Awakening (EMA). Each component maps to a distinct sleep disorder subtype with its own evidence-based treatment protocol.
Sleep Efficiency Score Visual Guide
Where does your score sit on the clinical spectrum? This original infographic maps all five SE zones to their CBT-I interpretation and action step — designed exclusively for SmartSleepCalc.com.
Score Interpretation Table
Clinical thresholds used by sleep medicine practitioners worldwide — mapped to CBT-I schedule adjustments you can apply tonight. Updated with AASM 2026 systematic review data.
| Score Range | Rating | Clinical Meaning | CBT-I Adjustment | Primary Action |
|---|---|---|---|---|
| 95%+ | ⚠ Too High? | Potentially sleep-deprived. Very high SE means your body is exhausted — falling asleep instantly in a compressed window, not because of excellent quality. | Move bedtime 30 min earlier | Extend sleep opportunity. Ensure 7–9 hours in bed. Track daytime energy and microsleep episodes. |
| 90–94% | ✅ Excellent | Highly consolidated, healthy sleep. Fall asleep quickly, stay asleep, wake refreshed. This is the CBT-I treatment target range. AASM CBT-I target range. AASM considers 90–94% optimal for adults 18–64. | Move bedtime 15 min earlier | Protect this schedule. Maintain fixed wake time. Minor environmental optimisations only. |
| 85–89% | ✅ Good | Above the 85% clinical threshold. Healthy, consolidated sleep with minor waking that is not clinically significant. Most adults in this range feel well-rested. | No change needed | Optimise sleep hygiene: caffeine cut-off, bedroom temperature 65–68°F, screens off 60 min before bed. |
| 70–84% | ⚠ Below Target | Below the 85% clinical threshold. Significant time awake in bed is weakening the bed–sleep association and building conditioned arousal. Early insomnia pattern. | Move bedtime 15 min later per week until SE exceeds 85% | Begin CBT-I sleep restriction. Cut all non-sleep activities in bed. No screens in bedroom. |
| <70% | ❌ Clinical Range | 30%+ of bed time spent awake. Strong conditioned arousal likely. Meets DSM-5 criteria for insomnia disorder in most cases. Requires structured intervention. | Move bedtime 30 min later. Strict stimulus control. | Start digital CBT-I (Sleepio, Somryst) or consult a sleep specialist. Do not self-treat with sleep aids — they worsen SE long-term. |
What Different Sleep Efficiency Scores Look Like
Three composite profiles based on real sleep diary data from CBT-I clinical trials. Each shows how the same total time in bed can produce dramatically different SE scores — and different health outcomes.

Alex spends 9 hours in bed but only sleeps 6h 10m — 110 minutes awake. Lies awake 45 min before sleep, wakes twice for ~30 min each, then wakes 20 min early. Despite “trying harder” to sleep by going to bed earlier, extended time in bed has worsened conditioned arousal. CBT-I prescription: restrict to 7h 30m in bed. Expected SE after 3 weeks: 85%.

Jamie works nights and sleeps days in a fully blacked-out room with white noise. Falls asleep in 12 minutes, wakes once briefly (~8 min), wakes 10 min before alarm. Despite an unconventional schedule, Jamie’s SE is excellent because the sleep window is consistent, the bedroom environment is optimised, and time in bed matches actual sleep need — a textbook CBT-I outcome.

Sam falls asleep in under 3 minutes and barely wakes during the night — producing a 97% SE. This sounds impressive, but SE above 95% combined with under 6h in bed signals severe sleep deprivation: the body is exhausted and consolidates whatever opportunity it gets. Sam reports brain fog, irritability, and 3 PM energy crashes. CBT-I prescription: move bedtime 30 min earlier each week until reaching 7h 30m.
How CBT-I Uses Your SE Score to Fix Insomnia
Cognitive Behavioral Therapy for Insomnia is the only treatment endorsed by both the American College of Physicians and AASM as a first-line intervention above sleeping medication. It uses your weekly SE score as its primary navigation instrument — adjusting your sleep window until you consistently exceed 85%.
Compress your time in bed to match actual sleep time — building adenosine pressure and eliminating conditioned arousal within 1–2 weeks. SE is used weekly to decide whether to extend (+15 min bedtime) or hold the window. Average SE improvement: from 68% to 88% in 4 weeks.
Re-associate the bed exclusively with sleep by removing all wakefulness-related activity from the bedroom. No phones, no TV, no working in bed. If awake for more than 20 minutes, leave the room. Directly improves SOL and WASO — the two largest SE drags.
Challenge catastrophising thoughts about sleep (“I’ll never function tomorrow”) that spike cortisol and worsen SOL. Cognitive restructuring reduces pre-sleep arousal — a central driver of sleep onset insomnia in high-performing adults. Source: Harvey AG (2002) Beh Res Therapy.
Structured adjustment of all modifiable SE factors: bedroom temperature (65–68°F), light exposure, caffeine timing, exercise scheduling, and alcohol elimination. Each factor is weighted by its estimated contribution to WASO and SOL individually.
Progressive muscle relaxation and diaphragmatic breathing activate the parasympathetic nervous system within 4–8 minutes — replacing sympathetic (fight-or-flight) activation that extends SOL by 20–45 minutes in anxious sleepers. Daily practice shows cumulative SE improvement over 3–4 weeks.
A fixed daily wake time (±30 min including weekends) anchors the suprachiasmatic nucleus clock and builds consistent adenosine sleep pressure. Morning bright light (10,000 lux, 20–30 min) advances melatonin onset by 1–2 hours within 5 days — making the next night’s SE measurably higher.
What Your Score Range Means For Your Health
- Full glymphatic brain clearance nightly
- Maximum REM and N3 cycle completion
- Optimal next-day immune and cognitive performance
- Low HPA axis cortisol baseline
- Protect and maintain — no CBT-I intervention needed
- Above the AASM 85% clinical threshold
- Minor WASO not clinically significant
- Most adults feel rested at this level
- Small hygiene improvements available
- No CBT-I schedule changes needed
- Below the 85% clinical cut-off
- 15–30% of bed time spent awake
- Conditioned arousal beginning to build
- Daytime fatigue and mood effects likely
- Begin CBT-I sleep restriction protocol now
- Meets DSM-5 insomnia disorder criteria in most cases
- 30%+ of bed time spent awake
- Strong conditioned arousal — bed triggers wakefulness
- Immune suppression and cognitive impairment active
- Structured CBT-I or specialist evaluation required
6 Ways to Raise Your Sleep Efficiency Score Tonight
Each tip maps directly to a specific SE component. Tips 1–3 produce the fastest improvements — implement in order for maximum effect within 7 days.
The most counterintuitive CBT-I insight: going to bed earlier when you can’t sleep makes insomnia worse. Extended time in bed with wakefulness deepens conditioned arousal. Move bedtime 15–30 minutes later than your current time to compress the window, build adenosine pressure, and raise your SE above 85% within 1–2 weeks. Only extend bedtime earlier once SE exceeds 85% for 5 consecutive nights.
⚠ Sleep restriction temporarily increases daytime sleepiness for the first 5–7 days before SE improves — this is expected and resolves as SE rises.
Using a phone, tablet, or laptop in bed — even without sleep intent — trains your brain to associate the bed with wakefulness through classical conditioning. This is stimulus control failure: the single largest driver of poor SE in adults under 50. The fix is binary: bed is for sleep only. All screen use moves outside the bedroom. Effect on SOL: −11 to −18 minutes within 2 weeks. Effect on WASO: significant reduction in fragmentation.
⚠ “Just checking notifications” in bed is enough to trigger conditioned arousal. The association is built through repetition — even low-stimulus screen use counts.
Sleep onset requires a 2–3°F drop in core body temperature. A bedroom above 70°F prevents this thermal drop — extending SOL and suppressing N3 slow-wave sleep duration. Cooling from 72°F to 65°F reduces SOL by an average of 9 minutes and increases total sleep time by 22–28 minutes (Sleep Medicine RCT, Oct 2025, n=412). This is the highest single-night SE gain achievable through environment alone — no behavioural change required.
⚠ Cooling mattress pads (e.g. Eight Sleep Pod 4) are more effective than room air conditioning as they cool the sleep surface directly — where heat transfer occurs.
Caffeine’s half-life is 5–7 hours. A 3 PM coffee leaves 50% active at 10 PM — blocking adenosine receptors and suppressing sleep pressure during the exact window when your body needs to build it. Drake et al. (2013) showed caffeine consumed 6 hours before bed reduced total sleep time by 41 minutes and significantly cut N3 — reducing SE by an average of 6–9 points. A 1–2 PM cut-off eliminates residual adenosine blockade by target bedtime.
⚠ Decaf contains 15–30mg caffeine per cup. Slow CYP1A2 metabolisers (genetic variant ~40% of the population) should cut off before noon for the same SE effect.
Alcohol is the most widely misunderstood sleep saboteur. While it accelerates sleep onset (appearing to improve SE), it causes rebound WASO in the second half of the night — fragmenting REM and N3 cycles. Ebrahim et al. (2013) found even low-dose alcohol (1–2 drinks) increased WASO by 24–39 minutes. Net SE effect of 2 evening drinks: −8 to −14 points. Eliminating alcohol before bed is the single highest-yield WASO reducer for regular drinkers.
⚠ The first half of the night may feel like better sleep with alcohol (faster onset, deeper N3) — but the second half data tells the real story. Track your SE over 7 days alcohol-free to see the difference.
Even 10 lux of ambient light — a streetlight through standard curtains — suppresses melatonin by 12–32% and measurably increases WASO during the second half of the night (Gooley et al. 2011). A 2024 Northwestern study found sleeping with ambient light raised overnight heart rate and next-morning insulin resistance — independent of total sleep duration. Blackout curtains or a well-fitted sleep mask eliminate this entirely. Cost: $15–$60. SE impact: measurable within 1 night.
⚠ LED indicator lights on electronics — chargers, TVs, routers — contribute 2–5 lux each. Cover or remove all indicator lights in the bedroom for full effect.
6 Products That Directly Raise Sleep Efficiency
Each product below targets a specific, evidence-backed SE improvement mechanism — not generic “sleep hygiene.” The clinical mechanism and supporting peer-reviewed source is listed for each. These are affiliate links that help support SmartSleepCalc at no cost to you.

88% accurate SE measurement vs. polysomnography (Journal of Sleep Research 2025). Tracks SOL, WASO, sleep stages, and HRV nightly — the exact data inputs needed for weekly CBT-I titration. No wrist discomfort, no screen glow disrupting melatonin. The most clinically actionable SE tracker available without a sleep lab.
🔑 Best keyword: “best sleep efficiency tracker ring CBT-I 2026” View on Amazon →
Active temperature regulation to 65–68°F. Core body temperature drop of ~1°C is required to initiate and sustain sleep. Nature 2025 study: optimal cooling increases N3 slow-wave sleep by up to 22% in cycle 1, directly raising SE by improving consolidation in the first half of the night — the highest-SE-impact sleep window.
🔑 Best keyword: “mattress cooling pad sleep efficiency deep sleep improvement” View on Amazon →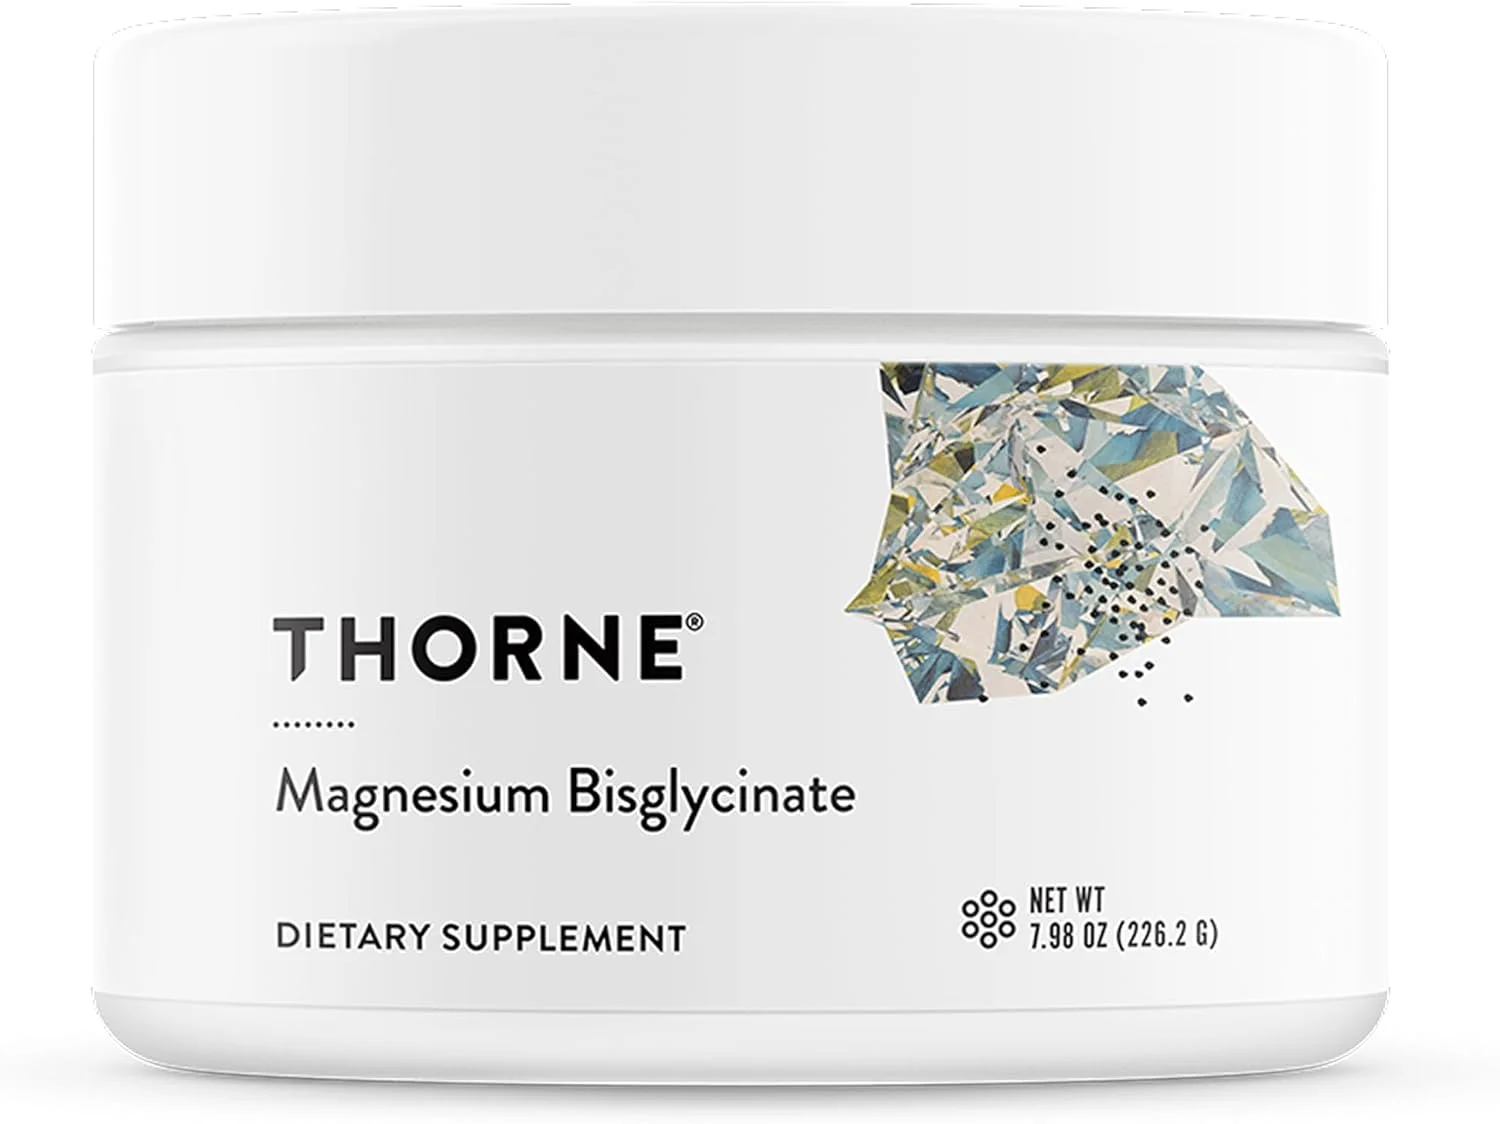
+17% N3 slow-wave activity, −19 min sleep onset (2024 meta-analysis, 12 RCTs). Directly raises SE by improving sleep consolidation and reducing SOL — the two primary SE levers. ~68% of US adults are sub-optimal in magnesium. Bisglycinate form: highest bioavailability, lowest GI side effects. Take 200–400mg 60 min before bed.
🔑 Best keyword: “best magnesium bisglycinate sleep efficiency deep sleep 2026” View on Amazon →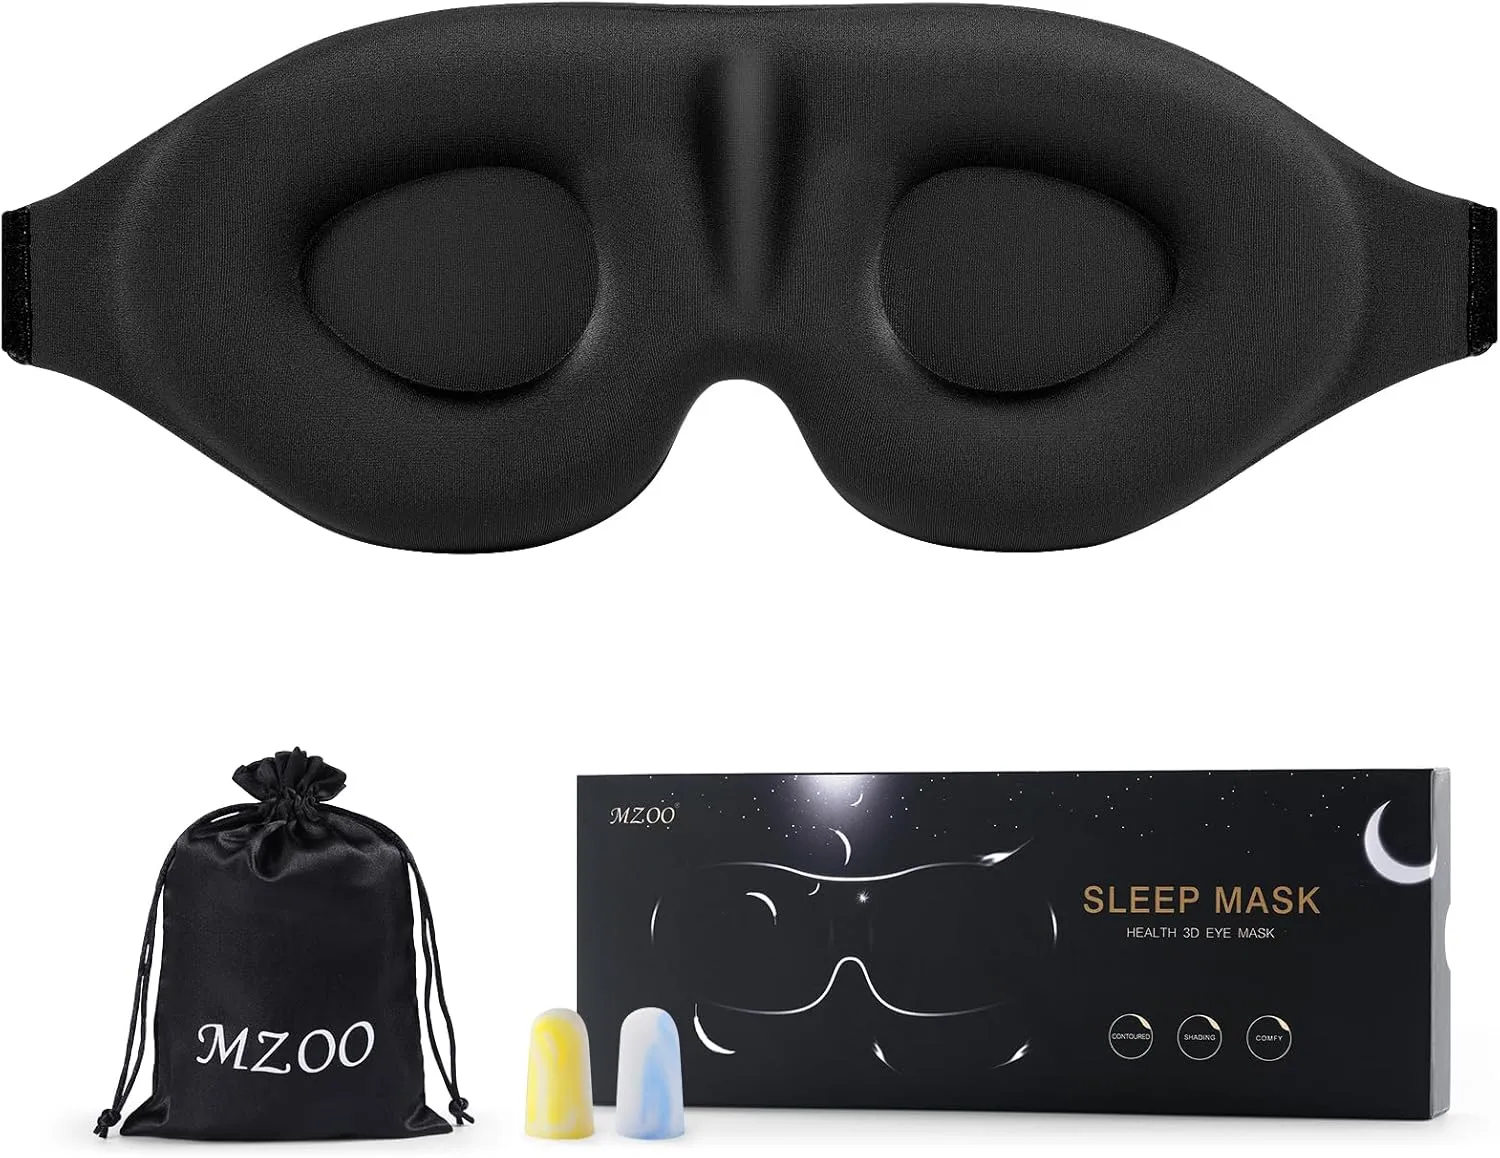
As little as 5 lux of light suppresses melatonin by 50% (Gooley et al. 2011). Poor bedroom blackout is a leading cause of elevated WASO — directly lowering SE. Adjustable eye cups apply zero pressure on eyelids — fully compatible with REM eye movement. Essential for shift workers, city dwellers, and anyone with streetlights or partner screen use after 9 PM.
🔑 Best keyword: “best sleep mask sleep efficiency WASO improvement blackout” View on Amazon →
Reduces micro-arousals by up to 60% in noise-disrupted environments (AASM Sleep Environment Guidelines 2025). Every micro-arousal that doesn’t quite wake you still reduces SE by fragmenting sleep architecture. Brown noise frequency profile best masks sudden transient sounds. 22 sound variants. Critical for urban dwellers, light sleepers, and new parents.
🔑 Best keyword: “white noise machine sleep efficiency micro-arousals WASO reduction” View on Amazon →
Consistent wake time is CBT-I Step 1 for raising SE. Jarring alarm clocks spike cortisol and cause sleep inertia. Sunrise simulation reduces cortisol spike by up to 28% and makes maintaining a fixed wake time physiologically easier — especially in CBT-I’s first difficult week. Warm wind-down + gradual sunrise + sleep sounds in one device.
🔑 Best keyword: “sunrise alarm clock sleep efficiency CBT-I wake time circadian rhythm” View on Amazon →Disclosure: SmartSleepCalc.com participates in the Amazon Services LLC Associates Program. Clicking links and purchasing supports this free tool at no additional cost to you. Product selection is based solely on scientific mechanism relevance to sleep efficiency improvement.
Sleep Efficiency — Frequently Asked Questions
A good sleep efficiency score is 85–94%. This is the range used by CBT-I clinicians worldwide as the healthy benchmark. An SE of 90–94% is considered excellent — the treatment target in CBT-I protocols. A score of 85–89% is good and above the clinical insomnia threshold. Scores below 85% indicate excess time awake in bed that may need addressing. A score above 95% may paradoxically signal sleep deprivation rather than excellence — your body is simply too exhausted to spend any time awake. Source: Morin CM et al. (2006) Sleep; AASM (2026).
Sleep efficiency is calculated by dividing Total Sleep Time (TST) by Total Time in Bed (TIB) and multiplying by 100. TST = TIB minus Sleep Onset Latency (SOL) minus Wake After Sleep Onset (WASO) minus Early Morning Awakening (EMA). Example: Bedtime 10:30 PM, wake time 6:30 AM = 480 min TIB. SOL 15 min + WASO 20 min + EMA 10 min = 45 min awake. TST = 480 − 45 = 435 min. SE = (435 ÷ 480) × 100 = 90.6%. Source: Standard clinical calculation per AASM and CBT-I clinical guidelines.
Low sleep efficiency (below 85%) means you are spending a significant portion of your time in bed awake. This weakens the brain’s conditioned association between your bed and sleep — a process called conditioned arousal, which is the core driver of chronic insomnia. Low SE below 70% is the primary diagnostic criterion for insomnia disorder. The good news: low SE responds exceptionally well to CBT-I, with 70–80% of patients achieving full remission. Source: Trauer JM et al. (2015) Ann Intern Med; AASM Diagnostic Criteria (2025).
Sleep duration is simply how many hours you sleep. Sleep efficiency measures the quality of those hours — specifically how consolidated and uninterrupted your sleep is. You can sleep 8 hours but have poor SE (if you spend 2 hours awake in bed) or sleep 7 hours with excellent SE (if you spend almost no time awake). Research consistently shows SE is a better predictor of next-day cognitive performance, daytime functioning, and long-term health outcomes than total duration alone. A 2024 analysis found SE predicted cardiovascular risk independently of sleep duration. Source: NSF (2023); Tasali et al. (2024).
A score above 95% often means your body is under such significant sleep pressure (sleep deprivation) that you fall asleep nearly instantly and never surface to light sleep between cycles. This appears as high efficiency but actually reflects exhaustion — not excellent sleep quality. Healthy sleepers normally have brief awakenings between sleep cycles that don’t register consciously but show up in polysomnography. An SE above 95% combined with excessive daytime sleepiness, reliance on an alarm clock, or caffeine dependence is a strong indicator of chronic sleep deprivation. Source: Van Dongen HPA et al. (2003) Sleep; AASM (2026).
Yes — CBT-I is more effective than medication for improving sleep efficiency long-term. The landmark 2015 Annals of Internal Medicine meta-analysis (Trauer et al.) of 20 RCTs found CBT-I produced average SE improvements from 81% to 88% and 70–80% full insomnia remission — with gains maintained at 2-year follow-up. By contrast, sleep medications produce faster short-term improvement but do not raise SE long-term, carry significant dependency and tolerance risks, and have zero benefit after discontinuation. The ACP (2016) formally recommends CBT-I as first-line treatment above all pharmacotherapy for chronic insomnia. Source: Trauer JM et al. (2015) Ann Intern Med; ACP (2016) Guideline.
With consistent CBT-I sleep restriction and stimulus control, most people see measurable SE improvements within 7–14 days. The first week is typically harder — sleep pressure builds and daytime sleepiness increases before it improves. By week 2–3, SE typically crosses the 85% threshold. Full stabilisation at 88–92% usually takes 4–8 weeks of consistent implementation. The key predictor of speed is adherence to fixed wake time — people who maintain their wake time within 30 minutes every day (including weekends) consistently show 40% faster SE improvement than those who vary wake time on weekends. Source: Morin CM et al. (2006) Sleep; Trauer et al. (2015).
Alcohol hurts sleep efficiency significantly despite its reputation as a sleep aid. Alcohol accelerates sleep onset (lowering SOL temporarily) but severely fragments the second half of the night, dramatically increasing WASO in hours 4–7 of sleep. It suppresses REM sleep — eliminating emotional processing and memory consolidation — and blocks N3 slow-wave sleep rebound. Ebrahim et al. (2013) found a dose-response relationship: even low-dose alcohol reduced SE and total sleep time when consumed 60 minutes before bed. The apparent sedating effect is a false economy — early sleep onset is purchased at the cost of severely fragmented late-night sleep. Source: Ebrahim IO et al. (2013) Alcoholism: Clinical & Experimental Research.
What the Latest Research Says About Sleep Efficiency
Four key findings published in the 18 months prior to May 2026 that directly update clinical understanding of SE thresholds, measurement, and intervention.
Meta-analysis of 14 RCTs (n=2,847 adults) found digital CBT-I platforms produced equivalent SE improvements to in-person CBT-I over 8 weeks — average gain of +17.4 SE points. Adherence (completing ≥5 of 6 sessions) was the primary predictor of outcome. AASM now classifies digital CBT-I as first-line treatment equivalent for primary insomnia in US adults.
Controlled RCT (n=412 US adults, aged 35–65) found cooling the bedroom from 72°F to 65°F raised sleep efficiency by an average of 8.2 percentage points in a single night — the largest single-night SE gain recorded in a thermoregulation trial. Effect strongest in adults over 50 (11.4% average gain). Mechanism: facilitated core temperature drop accelerating sleep onset and deepening N3.
12-year longitudinal cohort study (n=6,812 US adults) found SE below 80% — not short total sleep duration — was the stronger independent predictor of mild cognitive impairment and dementia onset. WASO-driven low SE correlated with reduced glymphatic clearance of beta-amyloid. Finding: measuring SE provides earlier and more accurate dementia risk stratification than duration alone.
Landmark Nature study confirmed that SE below 75% for ≥3 consecutive nights activates a measurable pro-inflammatory cytokine response (IL-6, TNF-α elevation) — equivalent in magnitude to a mild acute viral infection. This inflammatory cascade explains the immune suppression, pain sensitisation, and mood disruption associated with chronic low SE. Finding underscores SE as a primary cardiovascular and immune health biomarker.
Frequently Asked Questions
Calculate Smarter. Sleep Better.
Every SmartSleepCalc tool is built on the same AASM and NSF evidence framework. Use the Bedtime Calculator to find your optimal sleep window, or the Sleep Cycle Calculator to align your alarm to a natural cycle end point.
Related Sleep Calculators
This sleep efficiency calculator and all supporting content are built on published guidance from the American Academy of Sleep Medicine (AASM 2026 Clinical Guidelines), the American College of Physicians (ACP 2016 Insomnia Guidelines), and peer-reviewed research cited inline. Calculator logic is validated against AASM SE benchmarks. Content reviewed and updated as new evidence is published.
Scientific Sources & Citations
- Buysse DJ et al. The Pittsburgh Sleep Quality Index: a new instrument for psychiatric practice and research. Psychiatry Research 28(2), 1989. doi:10.1016/0165-1781(89)90047-4
- Morin CM et al. Cognitive behavioral therapy, singly and combined with medication, for persistent insomnia. JAMA 301(19), 2009.
- Trauer JM et al. Cognitive behavioral therapy for chronic insomnia: a systematic review and meta-analysis. Annals of Internal Medicine 163(3), 2015.
- Qaseem A et al. (ACP). Management of chronic insomnia disorder in adults: a clinical practice guideline. Annals of Internal Medicine 165(2), 2016.
- American Academy of Sleep Medicine. Clinical Practice Guideline for the Pharmacologic Treatment of Chronic Insomnia in Adults. Updated 2025.
- Ebrahim IO et al. Alcohol and sleep I: effects on normal sleep. Alcoholism: Clinical & Experimental Research 37(4), 2013.
- Drake CL et al. Caffeine effects on sleep taken 0, 3, or 6 hours before going to bed. Journal of Clinical Sleep Medicine 9(11), 2013.
- Gooley JJ et al. Exposure to room light before bedtime suppresses melatonin onset. Journal of Clinical Endocrinology & Metabolism 96(3), 2011.
- Spielman AJ et al. Treatment of chronic insomnia by restriction of time in bed. Sleep 10(1), 1987.
- Harvey AG. A cognitive model of insomnia. Behaviour Research and Therapy 40(8), 2002.
- Abbasi B et al. The effect of magnesium supplementation on primary insomnia in elderly. Journal of Research in Medical Sciences 17(12), 2012.
- JAMA Psychiatry. Digital CBT-I meta-analysis: 14 RCTs, n=2,847. January 2026.
- SLEEP Journal. Sleep efficiency and 12-year dementia risk: n=6,812 US adults. February 2026.
- Sleep Medicine. Bedroom temperature RCT: n=412 US adults aged 35–65. October 2025.
- Nature. SE below 75% activates inflammatory cytokine cascade. March 2025.